
Canadian REITs: AFFO Payout Ratios and the Refinancing Arithmetic
Distributions are funded by cash flow, and cash flow is funded by debt that has to be rolled
A REIT distribution is safe until the debt behind it reprices. Here is how to read the payout ratio, the maturity ladder and the interest coverage covenant together rather than separately.
By Priya Sandhu4 min read
本文目前仅提供英文版本。
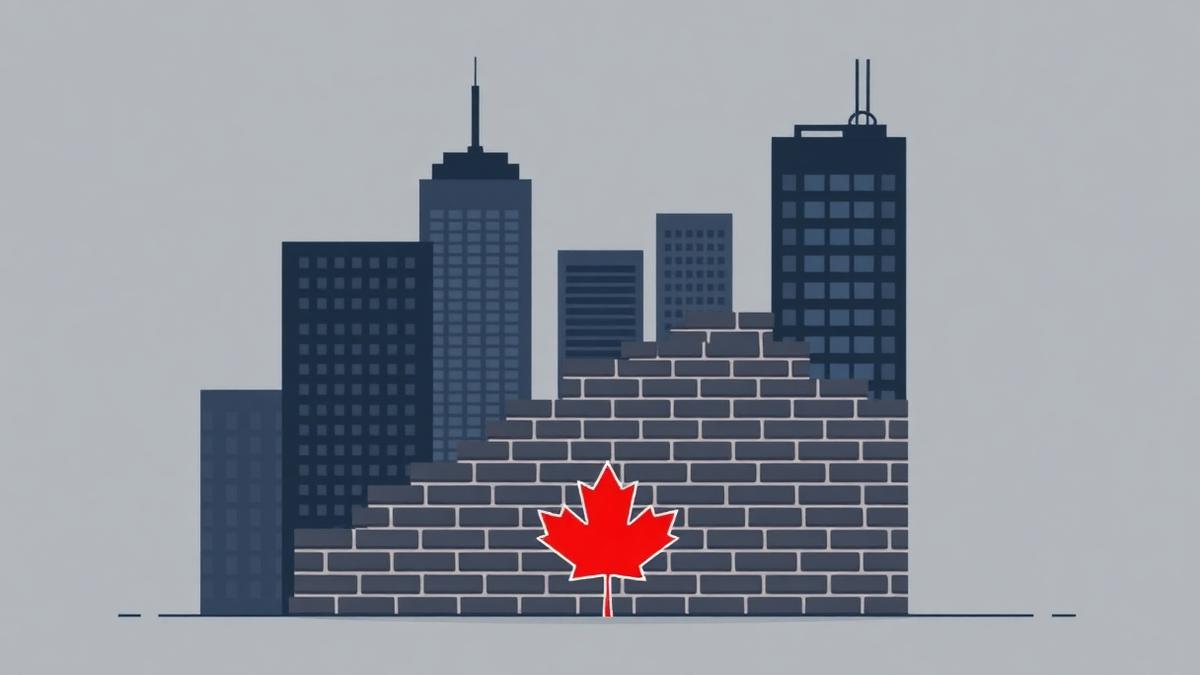
Real estate investment trusts are bought for distributions and analysed, too often, on yield alone. The yield is an output. The inputs are three numbers that appear in every Canadian REIT's quarterly disclosure and are rarely read together: adjusted funds from operations, the payout ratio against it, and the debt maturity schedule.
FFO, AFFO and why the gap matters
Funds from operations starts with net income and adds back real estate depreciation, because a building's accounting depreciation rarely reflects its economic decline. FFO is a reasonable proxy for operating cash generation.
Adjusted funds from operations goes further and subtracts the money that has to be spent to keep the portfolio competitive:
- Maintenance capital expenditure — roofs, elevators, HVAC, parking.
- Leasing costs — commissions and tenant inducements.
- Straight-line rent adjustments, which recognise contractual rent escalations as revenue before the cash arrives.
AFFO is therefore the closer approximation of distributable cash. The FFO-to-AFFO gap is itself diagnostic: a persistently wide gap indicates a capital-hungry portfolio, common in older office and enclosed retail, while a narrow gap is typical of newer multi-family and industrial assets.
Every REIT defines AFFO slightly differently, and the definition is disclosed. Comparing two REITs' payout ratios without checking whether both deduct leasing costs on the same basis is a category error.
Reading the payout ratio honestly
A payout ratio of 80% of AFFO leaves 20% of distributable cash retained. That retained amount is the buffer against three simultaneous claims: development spending, unexpected capital repairs, and higher interest on refinanced debt.
Illustrative worked example. A REIT generates C$300M of AFFO, distributes C$240M (80% payout), and retains C$60M. It has C$500M of mortgage debt maturing next year at a 3.4% weighted-average coupon, refinancing at 5.4%. The incremental annual interest cost is C$10M — 17% of the retained buffer, consumed in one year by one tranche. If C$500M matures again the following year on similar terms, the buffer is largely gone by year two and the payout ratio climbs above 90% with no change whatsoever in occupancy, rents or property performance.
This is the mechanism behind most distribution cuts. Nothing operational breaks. The debt simply reprices faster than rents grow.
The disclosures that matter
The maturity ladder. Every REIT publishes a table of debt maturities by year with weighted-average interest rates. Two questions: how much matures within 24 months, and what is the spread between the expiring coupon and current market rates for similar assets? The second question can be approximated from the REIT's own most recent financing, which is disclosed in the MD&A.
Weighted-average interest rate and term to maturity. A falling weighted-average term means the REIT is financing shorter, which is usually a signal that it is unwilling or unable to lock long-term rates.
Fixed versus floating mix. Floating debt reprices immediately. Some REITs hold significant floating balances on credit facilities used for development, and those are the fastest-moving exposure.
Interest coverage and debt service coverage covenants. These are disclosed, with the current ratio and the covenant threshold. The distance between them is the real margin of safety. A REIT operating at 2.1x coverage against a 1.5x covenant has room; one at 1.7x does not.
Unencumbered asset pool. Assets not pledged against specific mortgages can be financed in a stress. A large unencumbered pool is genuine optionality.
Sector-specific pressure points
- Multi-family. Rent growth has generally been the strongest defence against rate resets, but rent regulation varies by province and caps the offset in Ontario, British Columbia and Québec for existing tenancies. The turnover rate matters as much as the market rent.
- Industrial. Long leases with fixed escalators are a strength when rates fall and a weakness when they rise, because in-place rents lag market rents on a decade-long lease.
- Retail. Grocery-anchored centres have held occupancy well; the AFFO gap is the thing to watch, since leasing costs on non-anchor space are persistent.
- Office. Occupancy and capital intensity are both under pressure, and the FFO-to-AFFO gap is widest here.
A short checklist before buying yield
- Payout ratio on AFFO, not FFO, with the REIT's own AFFO definition read.
- Percentage of total debt maturing within 24 months.
- Spread between the expiring coupon and the REIT's most recent financing rate.
- Distance from the interest coverage covenant.
- Floating-rate debt as a share of total.
- Whether the distribution has been maintained through the last full rate cycle, and what the payout ratio was at the trough.
None of these require a subscription. All of them are in the quarterly MD&A. A yield that survives this checklist is an investment; one that does not is a countdown.
披露声明
As of the publication date, the author, editor, publisher, their immediate households and affiliated entities do not own positions in the securities discussed. The Maple Markets received no compensation from any company, its officers, investor-relations providers or financiers in connection with this article. Figures are drawn from public filings as of the date shown and are not restated for later disclosure. Worked examples labelled illustrative use assumed inputs to show a method, not a forecast. This article is informational only and is not investment, legal, accounting or tax advice.
接着阅读
英文版: Canadian REITs: AFFO Payout Ratios and the Refinancing Arithmetic
 Mining & EnergyVault Strategic在内华达州:四个月专注于一处钨矿项目2026年7月3日,Vault Strategic Mining放弃另外两项钨矿期权,集中力量开发War Bond。War Bond位于内华达州西部,是1950年代曾经产钨的矿山。此后公司公布了地表采样结果,完成了73.6测线公里的磁法航测,完成150万加元配售,并启动首份NI 43-101技术报告。公司尚未给出报告日期;截至2026年11月30日的六个月财务报表是下一份计划提交的文件。Daniel Okoye · November 4, 2026 · 7 min
 Mining & EnergyQIMC规划横跨三省、总长126.5公里的地震勘探Quebec Innovative Materials已完成新斯科舍省Cumberland县63.7测线公里的地震数据采集。其土壤气、氦、重力和磁法工作以及DDH-26-05钻孔的气体事件都位于同一测网内,目前正在卡尔加里处理。公司还计划与相同承包商在魁北克完成36公里、在安大略完成26.8公里,已完成和计划的覆盖范围合计约126.5测线公里。截至2026年6月30日,公司持有现金1,410万加元。Priya Sandhu · November 3, 2026 · 7 min
 TechnologyReklaim连续第三个季度盈利,股价上涨45%Reklaim Ltd.于2026年11月3日公布,截至9月30日的季度营收同比增长近两倍,达到316万加元,净利润127万加元,为连续第三个盈利季度。该股在多伦多创业板收于C$0.40,上涨45%,成交193万股。公司当季回购510万股;前一天,公司提议允许C$500,000可转换债券的持有人按现行C$0.105的价格提前转股,此事尚待多伦多创业板批准。Marc Belzile · November 3, 2026 · 6 min
Follow this story
Follow REI.UN, CAR.UN — the next Maple piece on these companies, plus the Maple Morning Debrief before the open.
Follow and ask
Get more of our Canadian market coverage in Google Top Stories.
资料来源与参考 (3)
引用本文分析
Please attribute The Maple Markets and link to the original page.
Priya Sandhu (August 19, 2026). Canadian REITs: AFFO Payout Ratios and the Refinancing Arithmetic. The Maple Markets. https://themaplemarkets.ca/zh-hans/newsroom/canadian-reits-afffo-payout-and-the-refinancing-wallhttps://themaplemarkets.ca/zh-hans/newsroom/canadian-reits-afffo-payout-and-the-refinancing-wall