
Canada's Productivity Gap: Reading Capex Per Worker Into TSX Margins
The most cited statistic in Canadian economics, taken apart and made investable
Canada's productivity shortfall is discussed as a national failing. For investors it is more useful as a margin forecast: output per hour determines how much of revenue growth reaches operating income.
By Élise Galarneau3 min read
本文目前仅提供英文版本。
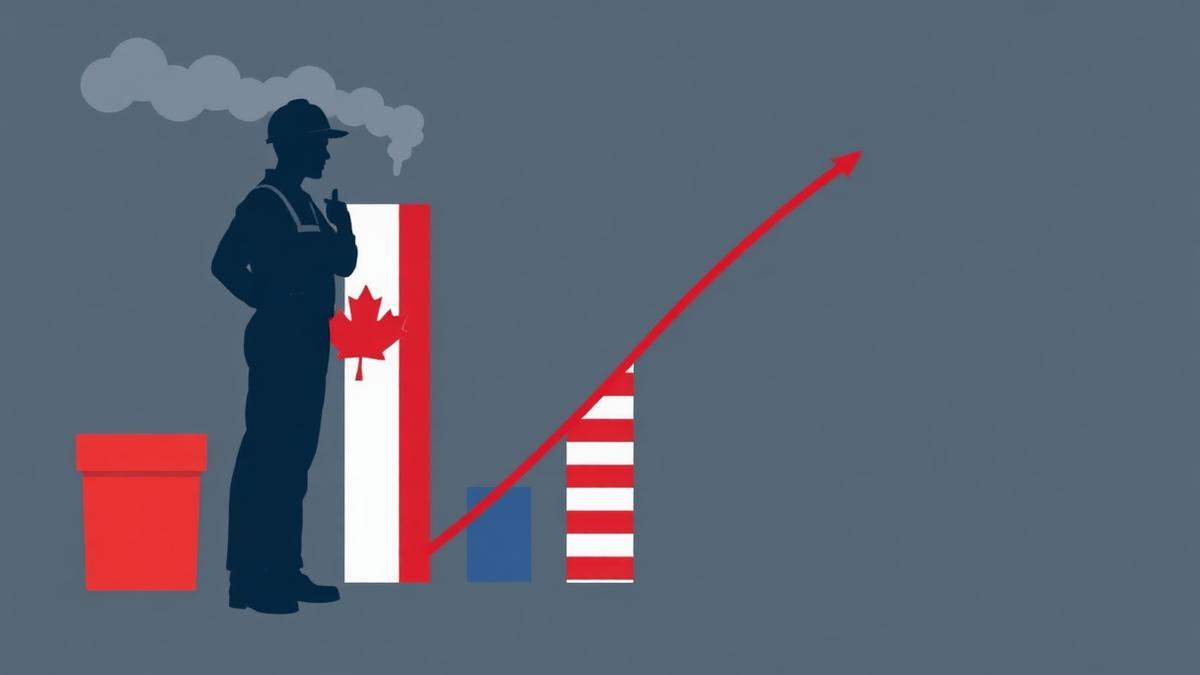
Canadian labour productivity — real GDP per hour worked — has grown more slowly than in the United States for a sustained period, and the gap in levels is now large enough that officials describe it in emergency terms. The statistic is repeated constantly and analysed rarely. For an investor, the useful questions are narrow: what is being measured, why is Canada behind, and what does it imply for the companies on the TSX?
What the measure is
Labour productivity is real output divided by hours worked. It is not a measure of effort. It is overwhelmingly a measure of how much capital, technology and organisational capability each worker has to work with.
Three components drive it:
- Capital deepening — the amount of machinery, equipment, software and intellectual property per hour worked.
- Labour composition — the skills and experience mix of the workforce.
- Multifactor productivity — the residual, capturing technology diffusion, competition intensity, management quality and allocation of resources between firms.
Canada's shortfall is concentrated in the first and third. Capital investment per worker, particularly in machinery, equipment and intellectual property products, has run below the United States for years. That is measurable and is published by Statistics Canada.
Why the composition of the economy matters
Part of the gap is structural rather than a failure of management:
- Resource extraction is highly capital intensive and produces high measured output per hour, but investment is cyclical and lumpy. A period of low resource capex mechanically depresses national capital deepening.
- Firm size distribution. Canada has a larger share of employment in small firms, which invest less per worker in software and automation. Scale economies in technology adoption are real.
- Domestic market size and competition intensity. Concentrated domestic industries — telecommunications, banking, air travel, grocery — face less competitive pressure to invest. Protected margins reduce the urgency of capital deepening even as they support current profitability.
- Population growth composition. Rapid labour force growth raises total GDP while diluting capital per worker unless investment grows at the same pace. Measured productivity falls even as the economy expands.
That last point is analytically important and frequently confused: strong headline GDP growth alongside weak per-hour productivity is arithmetically consistent, and it describes recent Canadian data well.
The investment translation
Productivity growth sets the sustainable pace of real wage growth. Where wages grow faster than productivity, unit labour costs rise, and the cost lands somewhere: in prices if the firm has pricing power, or in margins if it does not.
Illustrative worked example. A Canadian services company grows revenue 5% with wage costs, 60% of its cost base, rising 4% and productivity flat. Unit labour cost rises roughly 4%. If the company can pass through 3% in price, operating margin compresses by roughly 60 basis points on a 15% starting margin. Repeat across three years without productivity improvement and the compounding effect on operating income is material even with healthy top-line growth.
This produces a straightforward screen for Canadian equities:
- Companies that can pass through cost inflation. Regulated utilities with cost-of-service frameworks, pipelines with tolling escalators, and consumer names with genuine brand pricing power.
- Companies whose output per employee is structurally rising. Software and asset-light platforms, where incremental revenue requires little incremental labour. Revenue per employee, disclosed or derivable, is the metric.
- Companies most exposed. Labour-intensive domestic services with regulated or competitive price ceilings — where wage inflation cannot be passed on and automation is slow.
What would change the trend
The measurable inputs to watch, all published:
- Business investment in machinery, equipment and intellectual property products as a share of GDP, quarterly from Statistics Canada.
- Non-residential business investment per worker.
- Business R&D intensity.
- Net foreign direct investment flows, which proxy the attractiveness of Canada as a place to deploy capital.
A durable improvement requires business investment per worker to rise faster than employment for several consecutive years. That is a slow variable, which is precisely why it is a poor trading signal and a good allocation signal.
The honest conclusion
The productivity gap is not a reason to avoid Canadian equities. Many TSX-listed businesses earn a large share of revenue outside Canada and are unaffected by domestic output per hour. It is a reason to be specific: within the domestically exposed part of the index, the gap functions as a persistent headwind to margin expansion, and it should be assumed rather than hoped away in any medium-term model.
披露声明
As of the publication date, the author, editor, publisher, their immediate households and affiliated entities do not own positions in the securities discussed. The Maple Markets received no compensation from any company, its officers, investor-relations providers or financiers in connection with this article. Figures are drawn from public filings as of the date shown and are not restated for later disclosure. Worked examples labelled illustrative use assumed inputs to show a method, not a forecast. This article is informational only and is not investment, legal, accounting or tax advice.
接着阅读
英文版: Canada's Productivity Gap: Reading Capex Per Worker Into TSX Margins
 Mining & EnergyVault Strategic在内华达州:四个月专注于一处钨矿项目2026年7月3日,Vault Strategic Mining放弃另外两项钨矿期权,集中力量开发War Bond。War Bond位于内华达州西部,是1950年代曾经产钨的矿山。此后公司公布了地表采样结果,完成了73.6测线公里的磁法航测,完成150万加元配售,并启动首份NI 43-101技术报告。公司尚未给出报告日期;截至2026年11月30日的六个月财务报表是下一份计划提交的文件。Daniel Okoye · November 4, 2026 · 7 min
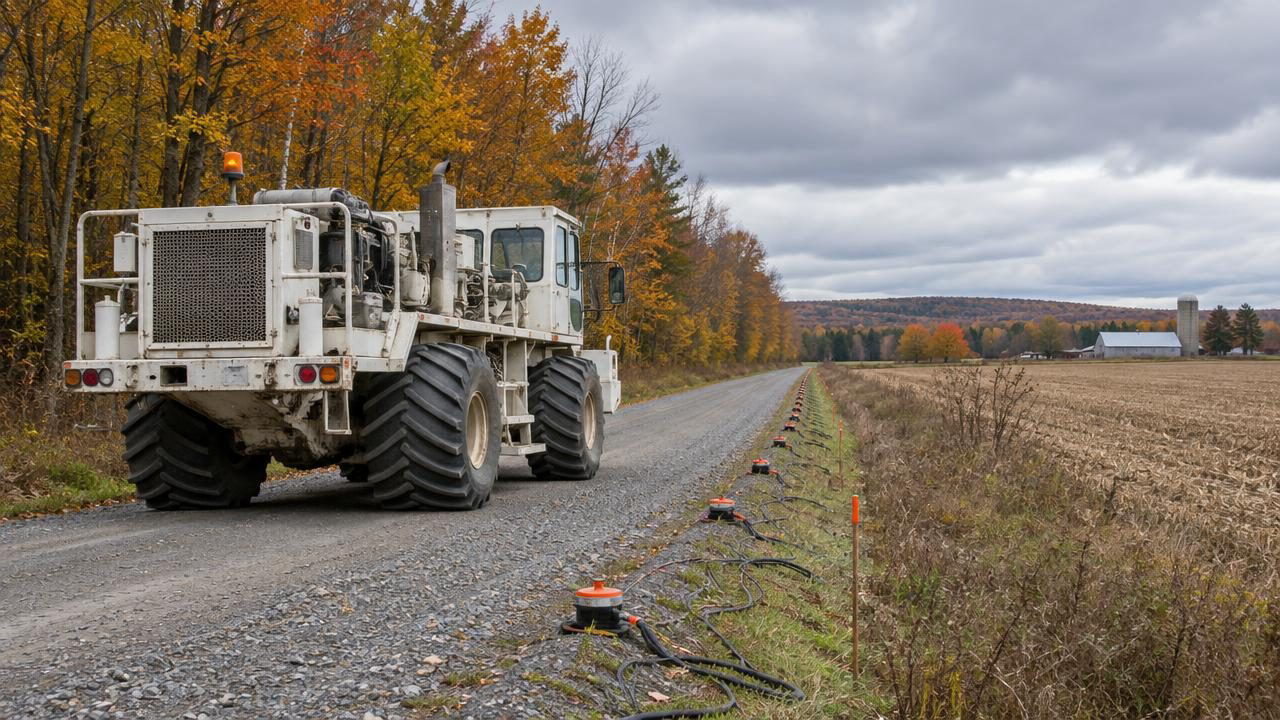 Mining & EnergyQIMC规划横跨三省、总长126.5公里的地震勘探Quebec Innovative Materials已完成新斯科舍省Cumberland县63.7测线公里的地震数据采集。其土壤气、氦、重力和磁法工作以及DDH-26-05钻孔的气体事件都位于同一测网内,目前正在卡尔加里处理。公司还计划与相同承包商在魁北克完成36公里、在安大略完成26.8公里,已完成和计划的覆盖范围合计约126.5测线公里。截至2026年6月30日,公司持有现金1,410万加元。Priya Sandhu · November 3, 2026 · 7 min
 TechnologyReklaim连续第三个季度盈利,股价上涨45%Reklaim Ltd.于2026年11月3日公布,截至9月30日的季度营收同比增长近两倍,达到316万加元,净利润127万加元,为连续第三个盈利季度。该股在多伦多创业板收于C$0.40,上涨45%,成交193万股。公司当季回购510万股;前一天,公司提议允许C$500,000可转换债券的持有人按现行C$0.105的价格提前转股,此事尚待多伦多创业板批准。Marc Belzile · November 3, 2026 · 6 min
订阅 Maple Morning Debrief
前一交易日收盘、隔夜行情,以及开盘前值得关注的要点 —— 美东时间早上 6 点前送达您的邮箱。免费,一键退订。
Follow and ask
Get more of our Canadian market coverage in Google Top Stories.
资料来源与参考 (3)
引用本文分析
Please attribute The Maple Markets and link to the original page.
Élise Galarneau (August 24, 2026). Canada's Productivity Gap: Reading Capex Per Worker Into TSX Margins. The Maple Markets. https://themaplemarkets.ca/zh-hans/newsroom/canada-productivity-gap-capex-per-worker-tsx-marginshttps://themaplemarkets.ca/zh-hans/newsroom/canada-productivity-gap-capex-per-worker-tsx-margins