
The quote is not the margin: what a copper and gold week is worth to a Canadian mine in loonies
A holiday walk from a US-dollar metal price through the C$1.3840 exchange rate to the Canadian-dollar cash margin a producer reports, and why the same week reads as a financing window, not a margin, for a Venture explorer.
Copper traded at US$6.58 per pound on September 6, 2026, gold near US$4,331 per ounce on September 1, and the Bank of Canada's metals and minerals index rose 4.2 per cent in August. None of those is a Canadian producer's margin. This piece walks the arithmetic from the US-dollar quote through the exchange rate to the Canadian-dollar cash margin, shows what a five per cent stronger loonie does to it, and explains why a pre-revenue explorer reads the same week as a financing window.
By Daniel Okoye9 min read
Copper
US$6.58 / lb on September 6, 2026
near the record US$6.83 / lb set in August 2026; about +46 per cent year on year (COMEX/LME market data).
Gold
US$4,331 / oz on September 1, 2026
roughly +24 per cent year on year (market data).
BCPI metals and minerals
1,165.55 in August 2026
up 4.2 per cent from 1,118.44 in July 2026; 1,217.14 in May 2026 (Bank of Canada).
USD/CAD
C$1.3840 per US$1 on September 4, 2026
one Canadian dollar bought about US$0.7225 (Bank of Canada).
Illustrative margin swing
about 8 per cent
the change in the worked Canadian gold margin from a 5 per cent stronger loonie, with the metal price and the Canadian-dollar cost base held fixed (assumed inputs, this piece).
For the week that ended on Friday, September 4, 2026, the busiest names on the Canadian small-cap tape were miners. Of roughly 42 ranked rows on the day's most-active lists, 23 were classed Mining and Metals, with gold and copper the two busiest niches. The prices behind that attention were high: copper traded at US$6.58 per pound on September 6, 2026, close to the record US$6.83 set in August 2026, and gold changed hands near US$4,331 per ounce on September 1, 2026. The Bank of Canada's commodity price index for metals and minerals rose 4.2 per cent in August, to 1,165.55 from 1,118.44 in July, according to the Bank's published series.
Those are the numbers that will be quoted, and none is the number a Canadian mine lives on. A Canadian producer does not earn a metal price; it earns a margin, counted in Canadian dollars after a cost base that is mostly paid in Canadian dollars. That gap is the arithmetic a reader will need when the September quarterlies are filed.
The metal is priced in one currency and mined in another
Copper and gold are priced in US dollars, the copper benchmark on the London Metal Exchange and the spot quotes on COMEX and the LME. A Canadian mine is paid in US dollars for its ounces and pounds, so its revenue line is a US-dollar price multiplied by an exchange rate before anything else happens.
Now the exchange rate. The US dollar was worth C$1.3840 on September 4, 2026, according to the Bank of Canada's daily rate; one Canadian dollar bought about US$0.7225.
Next, the costs. A Canadian mine pays wages, power, contractors, fuel and provincial royalties largely in Canadian dollars. The cash cost per ounce is the direct cost of mining and processing one unit of metal; the all-in sustaining cost, or AISC, adds the sustaining capital, exploration and overhead needed to keep the operation running at its current rate. Both are commonly reported in US dollars per ounce for comparison with peers, which is a trap: a US-dollar AISC moves when the loonie moves, even if not one dollar of Canadian spending changed.
The cash margin is the last step: Canadian-dollar revenue per ounce less Canadian-dollar cost per ounce. Two of the four inputs, the exchange rate and the cost base, never appear in a metals headline, and they are the two a Canadian reader is best placed to check.
It is therefore inaccurate to say that gold roughly 24 per cent above its level of a year earlier, or copper up about 46 per cent, means a Canadian producer's margin is up by the same amount. The quote establishes the revenue line in US dollars; it establishes nothing about the cost base, which is disclosed quarterly, or the exchange rate on the days the metal was sold. The tape does not support a margin claim on its own; the quarterly does.
One illustrative ounce, walked from the quote to the margin
Consider an illustrative, unhedged Canadian gold producer. Unhedged means it has not locked in a future exchange rate or gold price with a bank. The inputs below are assumed for the worked example, not drawn from any one company, and are labelled as such; the point is the direction and size of the effects, not a forecast.
| Line | US-dollar view | Canadian-dollar view (at C$1.3840 / US$1) |
|---|---|---|
| Gold price (September 1, 2026) | US$4,331 / oz | C$5,994 / oz |
| Assumed all-in sustaining cost | US$1,700 / oz | C$2,353 / oz |
| Illustrative cash margin | US$2,631 / oz | C$3,641 / oz |
| If the loonie strengthened 5 per cent | US$4,331 / oz | C$5,714 / oz |
| Margin at the stronger loonie | US$2,631 / oz | C$3,361 / oz |
The first row translates the quote: US$4,331 at C$1.3840 is C$5,994 an ounce of revenue. The second translates the assumed cost base, US$1,700, to C$2,353. The third is what is left, C$3,641 an ounce, the line a Canadian income statement will show.
The last two rows are the sensitivity. Hold the gold price at US$4,331, hold the Canadian-dollar cost base where it is, since wages and the power bill do not change when the currency does, and let the loonie strengthen five per cent. The same ounce now brings in C$5,714 and the margin falls to C$3,361. That is a reduction of roughly eight per cent in the Canadian margin with the metal price not having moved at all.
It runs in reverse just as cleanly: a weaker loonie widens the Canadian margin while gold stands still, which is the quiet reason a soft Canadian dollar has flattered reported producer earnings through this run. Two producers with identical US-dollar costs can report different Canadian margins if one hedges its currency and the other does not, and the effect is largest for the highest-cost producers, whose thinner margins move by a larger fraction.
A junior with no revenue earns a window, not a margin
The most-active lists this week were dominated by explorers, and an explorer with no revenue earns nothing from US$6.58 copper. Nothing enters its treasury when the price rises.
What a strong tape gives a pre-revenue company is a financing window. In practice, rising metal prices lift investor appetite for the whole sector, and while it lasts a junior can sell new equity on terms it could not get in a flat market. A private placement sells new shares directly to selected investors without a prospectus. A bought deal is the version in which an underwriter commits to purchase the whole offering at a set price and carries the resale risk. The shares are often sold as units, a share plus a fraction of a warrant, the warrant being a right to purchase a further share at a fixed price for a fixed period. The size of that warrant is a fair barometer of how open the window is.
Canadian exploration has one more instrument. A flow-through share carries the company's right to deduct its eligible Canadian exploration spending, renounced to the subscriber, who takes the tax deduction instead; for that tax value the shares sell at a premium, and the money can only go into qualifying exploration.
For an explorer, the metal price is a proxy for the cost of capital, not for cash flow, and the two should never be confused on a strong week. The junior that raised money at a good price this month has bought drilling. It has not bought a margin.
What to read in the next quarterly, and where the public numbers live
The Canadian consequence is a reading list, not a verdict. When a producer's next quarterly arrives, the numbers to find are the ones the tape did not give you: the realised price per ounce or pound; the AISC in the currency it is stated in; the exchange rate used for the quarter; and any currency hedge book. A margin that rose because the loonie fell is a different quarter from one that rose because costs fell, even if the headline numbers match.
The inputs are public and free. This is where to check them:
- The metal price. The London Metal Exchange publishes the copper benchmark; the spot levels here are COMEX and LME market data as of September 1 and September 6, 2026.
- The exchange rate. The Bank of Canada publishes the daily USD/CAD rate; C$1.3840 is its September 4, 2026 observation.
- The sector-wide price. The Bank of Canada Commodity Price Index, the BCPI, is an index, published weekly and monthly (the monthly series is used here), of the US-dollar prices of the commodities Canada produces, weighted by their share of Canadian production. Its metals and minerals sub-index was 1,165.55 in August 2026; the all-items index was 708.61.
- The cost base. The producer's quarterly MD&A, filed on SEDAR+, is where the cash cost, the AISC and the hedge book are disclosed in full.
The BCPI is also the cleanest comparable for judging whether one strong week is a trend. The metals and minerals sub-index stood at 1,217.14 in May 2026, eased to 1,118.44 by July and recovered to 1,165.55 in August: a sector that looked to be rolling over in mid-summer was back near its spring level by month-end. That round trip is the reason to treat one strong week as a data point, not a direction.
How I read the week
In my reading, the metals week is real and its Canadian translation is unfinished. The revenue line is up; whether the margin is up by as much depends on two numbers that will not be known until the quarterlies are filed, the realised exchange rate and the cost base. The producers have been handed a currency tailwind and a metal tailwind at once, and only the filings will say how much of each survived the cost line. For the explorers, the week was a window, and windows are judged after they close, by what the money drilled.
The loonie, the metal and the window: three things to watch monthly
Three developments would change the reading, ordered by how much each would move it, not by how likely each is.
A sustained rally in the Canadian dollar would change the most. The worked example gives the size: five per cent of currency is worth roughly eight per cent of the illustrative gold margin with the metal held fixed. A weaker loonie works the other way and widens every unhedged margin without an extra ounce sold.
A roll-over in metal prices of the kind the BCPI recorded between May and July 2026 would change the US-dollar margin directly. It is the more obvious risk, and one a reader can watch monthly in the same index.
A closing of the financing window would change the least for producers and the most for explorers. It would show up as fewer and smaller bought deals, heavier warrant coverage and weaker flow-through demand, and it would raise the cost of capital for pre-revenue companies just when they need to fund drilling.
All three show up in public data, which is where to look. The metal price will be quoted again next week. Judge the producers on the margin they file, in the currency they pay their costs in, and the explorers on the terms of the money they raised while the window was open.
Transparency note
Transparency note. This is an independent big-picture analysis and editorial opinion piece produced by The Maple Markets editorial desk. It is not sponsored, promoted or commissioned, and no compensation of any kind has been received from any issuer, government body or organisation named in this article, or any party acting on their behalf. The analysis is based on public data available as of the publish date; every figure is attributed to its primary source, and the producer margin table is an illustrative worked example with assumed inputs, not a statement about any company. Nothing here is a recommendation to buy, sell or hold any security, and readers should not treat it as investment advice. Past prices do not guarantee future results. Policies: Editorial Standards · Financial Disclaimer.
Weiterlesen
Also in English: The quote is not the margin: what a copper and gold week is worth to a Canadian mine in loonies
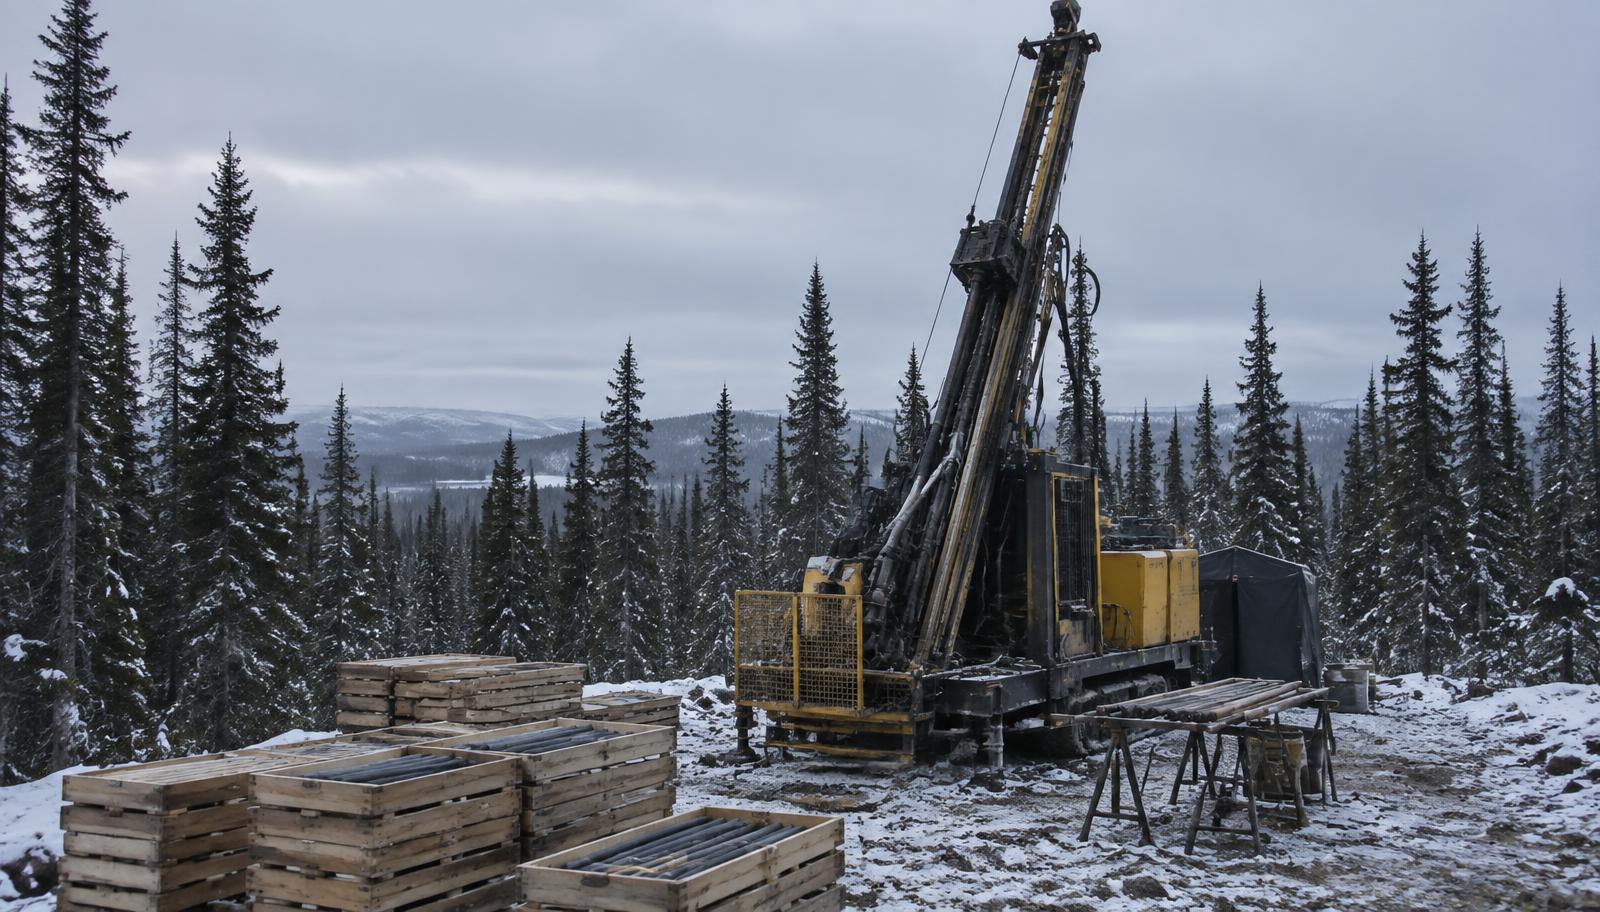 Mining and ResourcesEinen Kilometer vom nächsten Bohrloch entfernt erbohrte FireFox Gold 21 Meter mit 4.13 g/t in LapplandFireFox Gold Corp. (TSXV: FFOX) meldete am 16. September 2026, dass Bohrloch 26MJ032 auf Mustajärvi in Finnisch-Lappland 21.0 Meter mit durchschnittlich 4.13 g/t Gold durchteufte, mehr als 650 Meter von jeder früheren Bohrung entfernt. Die Aktie schloss bei C$0.63, ein Plus von 26.0 Prozent beim dreizehnfachen Durchschnittsvolumen. Zwei frühere Mitteilungen dieses Monats trugen höhere Gehalte und bewegten nichts. Verändert hat sich die Entfernung, dazu kam eine bezahlte Bewerbung am selben Tag.Priya Sandhu · 17. September 2026 · 7 min
 Mining and ResourcesBanyan Gold kommt in den GDXJ, mit 8.6 Millionen Unzen und ohne wirtschaftliche Studie dazuBanyan Gold Corp. (TSXV: BYN) teilte am 14. September 2026 mit, dass es am 21. September in den Index hinter dem VanEck Junior Gold Miners ETF aufgenommen wird. Sein Projekt AurMac im Yukon enthält 3.639 Millionen angezeigte Unzen und 4.985 Millionen abgeleitete Unzen Gold. Eine vorläufige wirtschaftliche Bewertung gibt es bisher nicht. Zum Dienstagsschluss bewertete der Markt das Unternehmen mit rund C$98 je Unze im Boden, oder C$233 je angezeigter Unze.Élise Galarneau · 15. September 2026 · 6 min
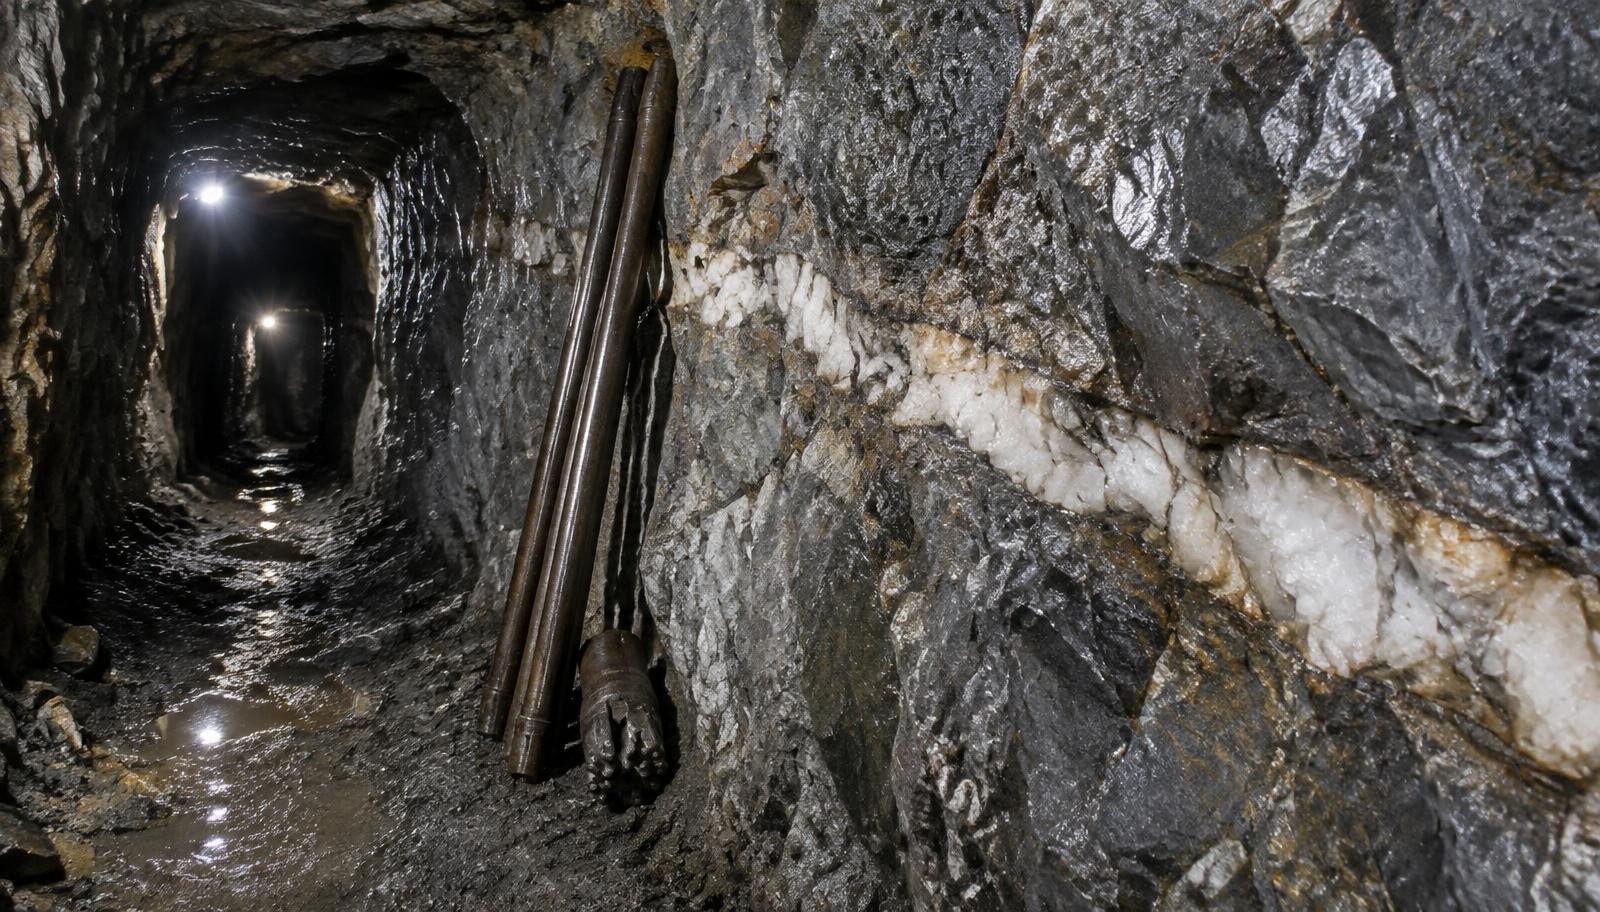 Mining and ResourcesAya Gold and Silver hat in Zgounder 3.501 g/t Silber erbohrt und daraus noch nichts verkauftAya Gold & Silver Inc. (TSX: AYA) meldete am 16. September 2026 hochgradige Silberabschnitte nahe der Grube von Zgounder und in der Tiefe, acht Tage nachdem das Unternehmen den Papierwert seines Projekts Boumadine verdoppelt hatte, und fünfzehn Tage nach der Vereinbarung über den Kauf eines Kupfer-Silber-Konzessionspakets. Die Aktie schloss am 17. September bei C$40,24. Das Unternehmen hält US$182,8 Millionen an Barmitteln, und rund 80 Prozent des Metalls in der Boumadine-Studie liegen in der spekulativsten Ressourcenkategorie, die es gibt.Élise Galarneau · 18. September 2026 · 8 min
Den Maple Morning Debrief erhalten
Der gestrige Schluss, die Nacht und worauf Sie vor der Eröffnung achten sollten — bis 6 Uhr ET in Ihrem Postfach. Kostenlos, Abmeldung mit einem Klick.
Folgen und fragen
Mehr von unserer Berichterstattung zu den kanadischen Märkten in Google Top Stories.
Meinung
Dieser Beitrag gibt die persönliche Meinung des Autors wieder, ist von der Nachrichtenberichterstattung getrennt und keine Anlageberatung.
Quellen und Verweise (4)
- Bank of Canada, Commodity Price Index (BCPI), monthly observations
- Bank of Canada, daily USD/CAD exchange rate
- London Metal Exchange, LME Copper (benchmark reference)
- US Federal Reserve, H.15 Selected Interest Rates (US-dollar rate context)
Diese Analyse zitieren
Bitte The Maple Markets nennen und auf die Originalseite verlinken.
Daniel Okoye (7. September 2026). The quote is not the margin: what a copper and gold week is worth to a Canadian mine in loonies. The Maple Markets. https://themaplemarkets.ca/de/newsroom/metals-week-canadian-producer-margins-and-junior-financingshttps://themaplemarkets.ca/de/newsroom/metals-week-canadian-producer-margins-and-junior-financings