
Barrick Mining: What the Reserve Replacement Numbers Actually Show
Barrick's flat headline reserve figure conceals a modest decline in grade at several large open pits and a rising share of reserves in jurisdictions with renegotiated fiscal terms. Both factors bear directly on future unit costs and the capital allocation choices management faces this year.
By Daniel Okoye4 min readTranslation: human
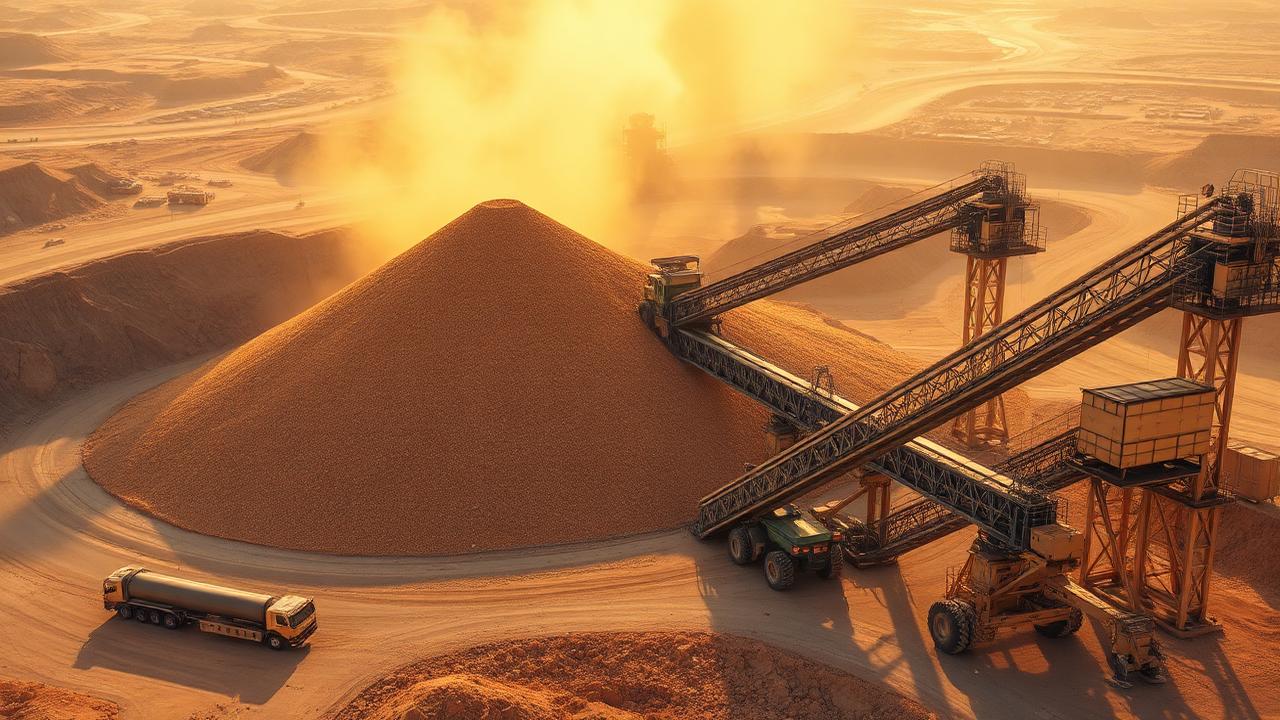
Attributable gold reserves
Broadly flat
Year over year
Reserve grade trend
Modestly lower
Open-pit assets
Sustaining capital
Rising
Per ounce basis
Barrick's annual reserve and resource statement showed attributable gold reserves broadly unchanged year over year, and the company presented that outcome as evidence of successful reserve replacement — a mining company's version of standing still being treated as a win, since every ounce mined during the year has to be replaced just to keep the reserve base flat. Analysts read the same numbers with considerably more nuance, because a flat headline reserve figure can conceal meaningful changes in the quality and location of what remains.
Why reserve replacement is the right frame, but an incomplete one
For any depleting-asset business like a gold miner, the basic arithmetic is unforgiving: a producer that mines ounces faster than it adds new ones to its reserve base is, functionally, liquidating itself over time, one year's production at a time. Reserve replacement at or near 100 per cent is therefore the minimum bar for a company to credibly claim it is sustaining itself rather than running down its asset base. Barrick clearing that bar is a legitimately positive outcome relative to the alternative. But replacement is a tonnage and ounce concept, and tonnage and ounces alone do not tell you what it will cost to extract those ounces or how much political and fiscal risk sits beneath them. Two companies can each report 100 per cent reserve replacement and be in very different competitive positions depending on what is inside that number.
The grade problem hiding inside a flat headline
Replacing ounces at a lower average grade than what was mined means that, going forward, more rock has to be moved and processed to produce the same amount of gold. Barrick's disclosure showed reserve grade declining modestly at several of its larger open-pit operations, and that decline does not show up immediately in production figures — a mine can still hit its production target with lower-grade ore by simply moving more tonnes. What it does show up in, with a lag of a year or more, is unit cost: mining, hauling and processing more tonnes per ounce produced pushes all-in sustaining costs higher even if nothing else about the operation changes. The company's own guidance already reflects some of this dynamic, which is itself a signal that the grade decline is being treated internally as a real cost driver rather than a rounding error. Investors who look only at the reserve replacement percentage and ignore the accompanying grade trend are missing the piece of the disclosure that has the most direct bearing on future margins.
Jurisdiction mix and the discount rate question
The reserve statement also showed a rising share of Barrick's reserves sitting in jurisdictions where fiscal terms — royalty rates, tax structures, or ownership requirements — have been renegotiated over the past decade. This is not, on its own, a reason to avoid the stock; large-scale gold deposits are geologically concentrated in a limited number of regions, and operating in jurisdictions with evolving fiscal regimes is close to unavoidable for a company of Barrick's scale. But it is directly relevant to how an investor should value long-dated ounces in the reserve base. Ounces that will be extracted a decade or more from now, in a jurisdiction where the fiscal terms have already been renegotiated once, carry more uncertainty about what share of that future revenue will actually accrue to shareholders than ounces in a jurisdiction with a longer track record of fiscal stability. Any investor applying a premium multiple to Barrick relative to peers should be able to articulate what portion of that premium rests on assets sitting in more stable regimes, because that is effectively a bet on political and fiscal continuity that the reserve statement itself does not resolve.
The capital allocation decision this sets up
With free cash flow strong at current gold prices, the reserve and grade picture feeds directly into the capital allocation choice management faces this year: buybacks, dividend growth, or further organic reinvestment in reserve development. The grade trend argues for caution on the reinvestment side specifically, because reinvesting capital to develop reserves at declining average grades is a lower-return use of that capital than it would have been a decade ago, when the ore being replaced was higher-grade. That does not mean organic reinvestment is the wrong choice in every case — some projects will still clear an acceptable return threshold even at lower grade — but it raises the bar that any specific reinvestment decision needs to clear, and it strengthens the relative case for returning cash to shareholders when a given project does not obviously clear that bar.
Reading next year's statement
The single most useful discipline for any investor following Barrick is to resist stopping at the top-line reserve replacement percentage. That number answers only the question of whether the company is standing still. The grade trend and the jurisdiction mix underneath it answer the more consequential questions of what it will cost to extract those reserves and how much of the value they represent is likely to actually reach shareholders.
What to watch
Track average reserve grade at Barrick's largest open-pit operations year over year, not just total attributable reserve ounces. Watch all-in sustaining cost guidance revisions for signs that the grade decline is feeding through to unit costs faster than expected. Monitor the jurisdictional breakdown of reserves for further shifts toward regions with renegotiated fiscal terms. And watch capital allocation announcements — the split between buybacks, dividend growth and reinvestment in reserve development — as the clearest signal of how management itself is weighing the returns available on developing lower-grade ounces.
Read next
 Mining and ResourcesThe quote is not the margin: what a copper and gold week is worth to a Canadian mine in looniesCopper traded at US$6.58 per pound on September 6, 2026, gold near US$4,331 per ounce on September 1, and the Bank of Canada's metals and minerals index rose 4.2 per cent in August. None of those is a Canadian producer's margin. This piece walks the arithmetic from the US-dollar quote through the exchange rate to the Canadian-dollar cash margin, shows what a five per cent stronger loonie does to it, and explains why a pre-revenue explorer reads the same week as a financing window.Daniel Okoye · September 7, 2026 · 7 min
 Mining and ResourcesCanadian Commodity Stocks in the Global CycleCanadian commodity producers are sensitive to the same global cycle. Here is how to read the signals and separate the quality operators from the price takers.Daniel Okoye · August 23, 2026 · 8 min
 Mining and ResourcesKinross Gold: Cash Returns, Great Bear and the Next Growth CycleKinross trades on the TSX as K and on the NYSE as KGC. Its principal producing assets include Tasiast in Mauritania, Paracatu in Brazil, Fort Knox and Manh Choh in Alaska, and Round Mountain and Bald Mountain in Nevada. Its development portfolio includes Great Bear in Ontario, Curlew in Washington and Lobo-Marte in Chile. In Q2 2026, Kinross produced approximately 492,000 gold-equivalent ounces, generated US$2.24 billion in revenue and US$726.8 million in free cash flow, and ended the quarter with US$2.7 billion of cash and US$1.9 billion of net cash.Daniel Okoye · August 5, 2026 · 3 min
Follow this story
Follow ABX — the next Maple piece on this company, plus the Maple Morning Debrief before the open.
Follow and ask
Get more of our Canadian market coverage in Google Top Stories.
Disclosure
Information only. Not investment advice. The Maple Markets does not hold positions in securities discussed. See the Financial Disclaimer.
Sources and references (2)
Cite this analysis
Please attribute The Maple Markets and link to the original page.
Daniel Okoye (April 10, 2026). Barrick Mining: What the Reserve Replacement Numbers Actually Show. The Maple Markets. https://themaplemarkets.ca/en/newsroom/barrick-mining-what-the-reserve-replacement-numbers-actually-showhttps://themaplemarkets.ca/en/newsroom/barrick-mining-what-the-reserve-replacement-numbers-actually-show