
The WCS Differential: Tracing Heavy Oil Discounts Into Canadian Earnings
From Hardisty to the income statement, with the integrated hedge that hides it
Every Canadian oil investor knows the WCS differential matters. Fewer can trace how a US$4 move in the discount travels through royalties, transport and refining margin to arrive at earnings per share.
By Marc Belzile4 min read
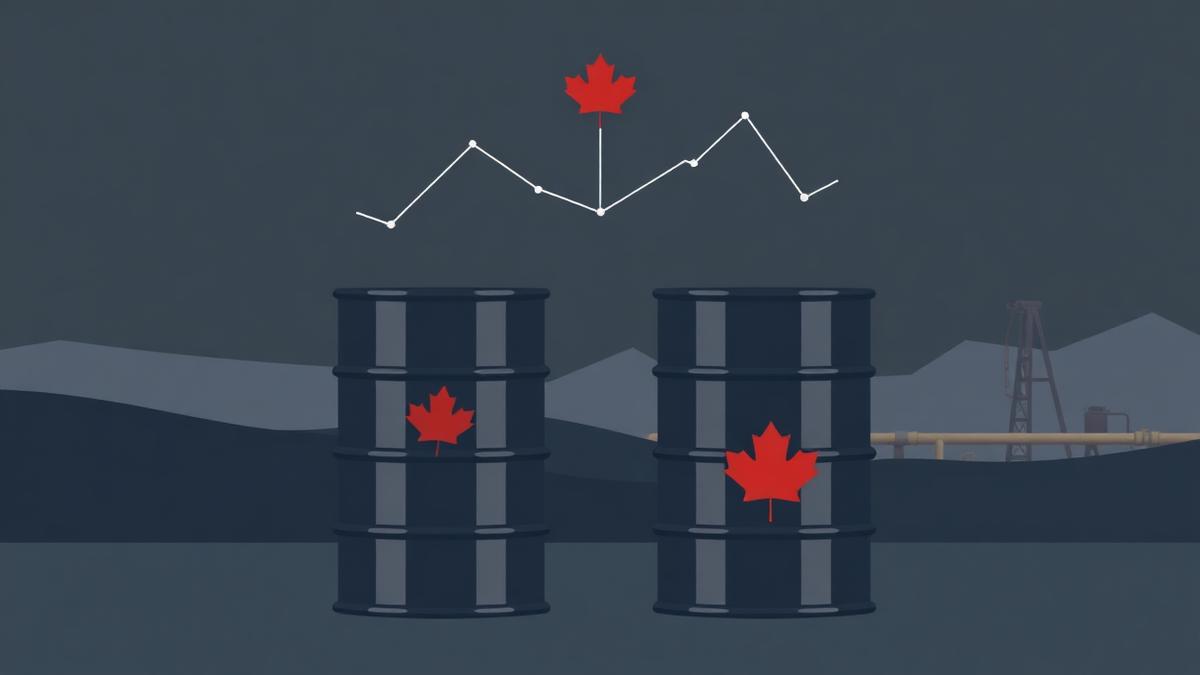
Western Canadian Select is a blended heavy sour crude priced at Hardisty, Alberta. It trades at a discount to West Texas Intermediate, and that discount — the differential — is the most important single price in Canadian oil. It is also widely misread, because the differential is not one thing. It is the sum of four separable components, and each behaves differently.
Decomposing the discount
1. Quality. Heavy sour crude yields less high-value product per barrel and costs more to process. Only refineries configured with coking capacity can run it economically. This component is structural and does not move much month to month; think of it as the floor of the discount.
2. Transportation. Hardisty is a long way from the Gulf Coast refining complex that consumes most Canadian heavy barrels. Pipeline tariffs set the baseline. When pipelines are full, the marginal barrel moves by rail at a materially higher cost, and the differential widens toward rail economics.
3. Egress scarcity premium. When production exceeds total takeaway capacity, the price is no longer set by transport cost — it is set by whatever it takes to clear the surplus barrel. This is the component that produces the violent episodes, and it is capacity-driven rather than demand-driven.
4. Refinery maintenance and demand timing. Turnaround season at Gulf Coast and Midwest refineries removes heavy-crude processing capacity temporarily, widening the differential on a seasonal rhythm.
The analytical value of the decomposition is that only components 2 and 3 are fixable by infrastructure, and only component 3 is capable of moving many dollars in weeks.
Tracing a move through to earnings
Take a producer selling 400,000 barrels per day of heavy crude and assume the differential widens by US$4.00 per barrel with WTI unchanged.
Illustrative worked example.
- Gross revenue impact: 400,000 × US$4.00 × 365 = US$584M per year.
- Crown royalties in Alberta are calculated on net revenue after allowed costs, and the rate is price-sensitive. A lower realised price reduces the royalty owed, so assume royalties absorb roughly 20% of the hit: the producer retains about US$467M of the loss.
- Operating costs are largely fixed per barrel and do not fall with price, so there is no offset there.
- At a 25% effective tax rate, the after-tax impact is approximately US$350M.
- On 1.8B shares, that is roughly US$0.19 per share of annual earnings — meaningful for a stock trading in the low twenties, and entirely outside management's control.
Now run the same move for an integrated producer that refines a large share of its own barrels. The upstream segment takes the same discount, but the downstream segment buys feedstock at that lower price and sells refined products priced off international benchmarks. The refining margin widens by approximately the same amount on the barrels processed internally. For a producer refining, say, 60% of its heavy production, roughly 60% of the differential move is recaptured downstream.
This is the single most important structural distinction in the Canadian oil patch, and it is why integrated names and pure-play heavy producers should never be valued off the same differential assumption.
Why egress capacity is the real variable
Because component 3 dominates the tail risk, the differential is fundamentally a capacity question. The relevant inputs are public:
- Total Western Canadian production versus total pipeline export capacity, including any newly commissioned systems.
- Line-fill and apportionment notices, which indicate a system is oversubscribed.
- Crude-by-rail volumes, published monthly. Rising rail volumes are the market telling you pipelines are full before the differential fully reflects it.
- Alberta storage inventories at Hardisty and Edmonton. Building inventories with full pipelines is the precondition for a blowout.
The hedging layer that obscures the picture
Producers hedge, and hedges are disclosed after the fact in the notes to the financial statements. A quarter in which the differential widened sharply can still produce an in-line realised price if the company had differential swaps in place. Two consequences follow:
- Realised price disclosure is a lagging and partially artificial indicator of exposure. Read the hedge note, not the headline realisation.
- Hedges roll off. A producer protected this year at favourable levels is fully exposed next year if the differential stays wide, and the market often prices the protected quarter as though it were structural.
What to watch
- Pipeline apportionment notices and monthly crude-by-rail volumes.
- The company's disclosed refining capacity as a percentage of its own heavy production.
- The hedge note: volumes hedged, instrument type, and expiry dates.
- Royalty structure sensitivity, disclosed in most Canadian producers' MD&A as a price-sensitivity table.
The differential will widen and narrow again; it always has. The durable question for any individual holding is not where the discount goes but how much of it the company keeps.
Read next
 EnergyThe Pressure Event Is the Result: Reading QIMC's 30.0% Hydrogen Update at Bennett HillQuébec Innovative Materials Corp. (CSE: QIMC) reported a record 30.0% H2 field reading at 413 metres in DDH-26-05 — then reported free gas reaching surface under apparent pressure between 413 and 416 metres, triggering repeated hydrogen alarms and halting the hole. Evidence for a mobile hydrogen-bearing system has strengthened. Evidence for reservoir performance has not. Benchmarked against MAX Power's completed-interval flow test at Lawson.Daniel Okoye · September 1, 2026 · 11 min
 EnergyThe Number Is Not the Discovery: How to Read a Natural-Hydrogen ResultQIMC reported 27.8% hydrogen at Bennett Hill; MAX Power reported 28.6% at Lawson. The headline percentages look interchangeable. The measurements behind them are at different stages of proof.Marc Belzile · August 30, 2026 · 9 min
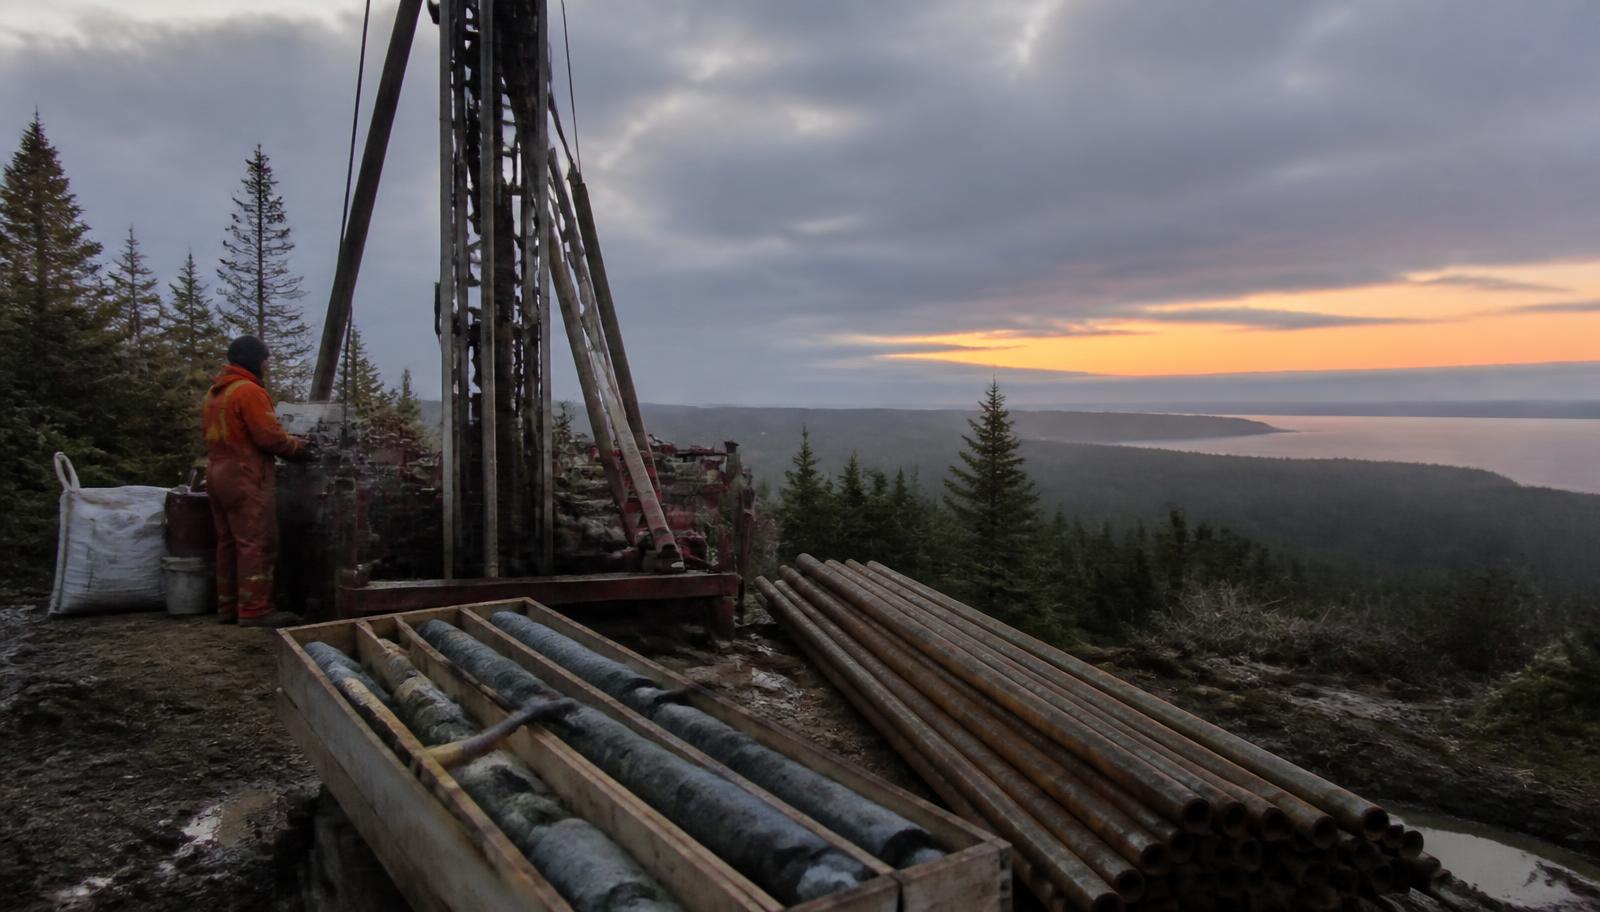 EnergyQIMC Extends the Bennett Hill Hydrogen System: Reading DDH-26-05Québec Innovative Materials Corp. (CSE: QIMC) has reported a company-record 27.8% hydrogen measurement at approximately 374 metres in DDH-26-05 at Bennett Hill, Nova Scotia. The readings are preliminary field measurements. Concentration establishes presence; it does not establish pressure, flow or recoverable volume.Daniel Okoye · August 26, 2026 · 9 min
Follow this story
Follow CVE, SU — the next Maple piece on these companies, plus the Maple Morning Debrief before the open.
Follow and ask
Get more of our Canadian market coverage in Google Top Stories.
Disclosure
As of the publication date, the author, editor, publisher, their immediate households and affiliated entities do not own positions in the securities discussed. The Maple Markets received no compensation from any company, its officers, investor-relations providers or financiers in connection with this article. Figures are drawn from public filings as of the date shown and are not restated for later disclosure. Worked examples labelled illustrative use assumed inputs to show a method, not a forecast. This article is informational only and is not investment, legal, accounting or tax advice. See the Financial Disclaimer.
Sources and references (3)
- SEDAR+ issuer filings
- Canada Energy Regulator — crude oil exports and pipeline capacity
- Alberta Energy Regulator
Cite this analysis
Please attribute The Maple Markets and link to the original page.
Marc Belzile (August 19, 2026). The WCS Differential: Tracing Heavy Oil Discounts Into Canadian Earnings. The Maple Markets. https://themaplemarkets.ca/en/newsroom/wcs-differential-how-it-reaches-canadian-oil-earningshttps://themaplemarkets.ca/en/newsroom/wcs-differential-how-it-reaches-canadian-oil-earnings